Background
Historical industrial property that utilized chlorinated solvents for equipment maintenance from the 1950s to 1970s. Materials are suspected to have been discharged to drain pipes which allowed for the migration of the product across the area. Site is still active with existing utilities and various structures. Contamination has been confirmed in both the unsaturated and saturated zones through High Resolution Characterization activities. Contamination has been identified from depths of 8 to 46 feet (2.4 to 14.0 m) with depth to groundwater at 15 feet (4.6 m). The site geology consists of interbedded sands, silts and clays associated with river sedimentation. TCE concentrations have been detected in groundwater at a maximum concentration of 730 mg/L and in soils at 5,350 mg/kg.
Project Timeline
- 2013 – Remedial Design Characterization (RDC) Advancement of 26 soil borings
- Collection of 186 soil samples (approximately every 2 ft. (0.6 m) bgs)
- Collection of 31 groundwater samples from micro wells
- Hydraulic Profile Testing/Hydraulic Conductivity testing along with Electrical Resistivity Testing to identify the bedrock profile
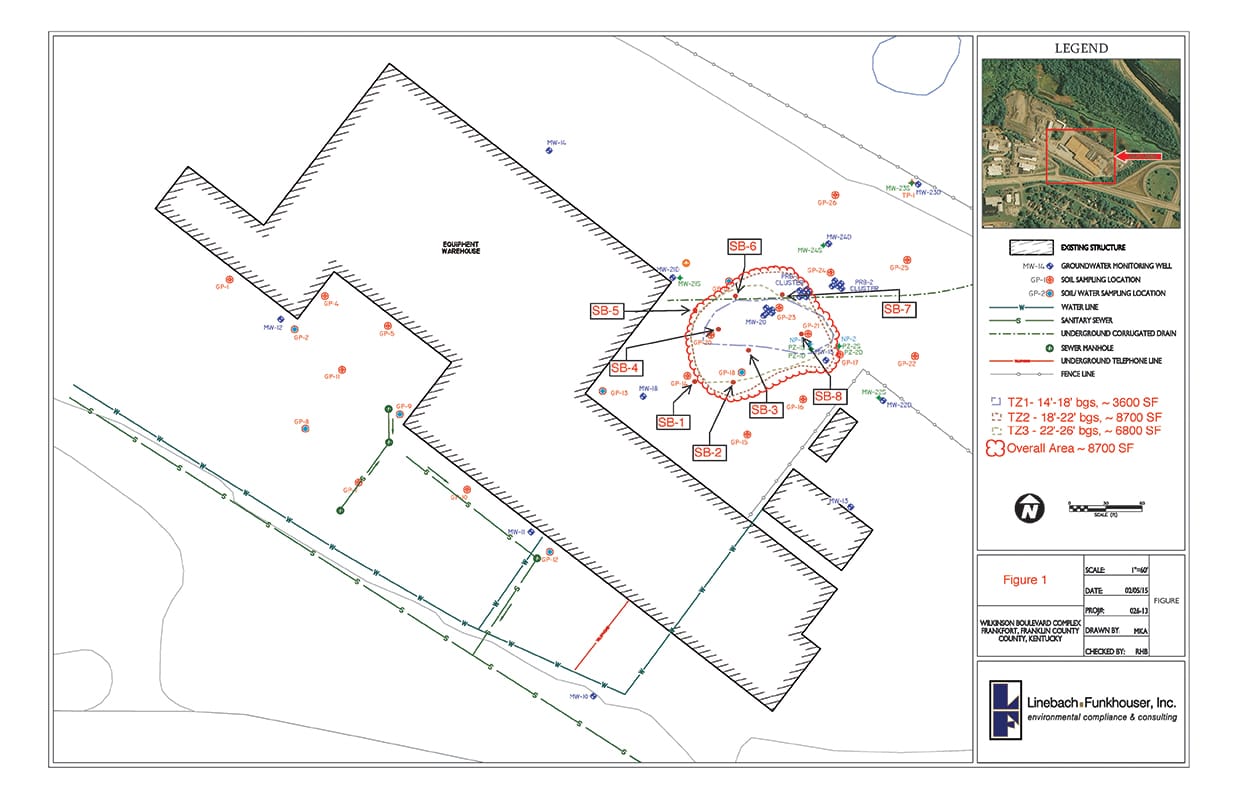
- 2014 – Injection of BOS 100® Permeable Reactive Barrier (PRB) (Figure 1.)
- 2015 – Soil Mixing of RemOx®L (Sodium Permanganate)(Figure 1.)
- 2020 – Injection of CAT 100 for source area treatment (Figure 1.)
Trap & Treat Injections
- 4,200 lbs (1905 kgs) of BOS 100® was applied in a 1600 feet2 (149 m2) area from a depth of 26 to 46 feet (7.9 to 14.0 m) bgs. BOS 100® was injected at 28 points on 7.5 feet (2.3 m) centers.
- 7,000 lbs ( of CAT 100 was applied in a 2,500 feet2 (232 m2) area from a depth of 8 to 30 feet (2.4 to 9.1 m) bgs. CAT 100 was injected at 69 points on 6 feet (1.8 m) centers.
Post Treatment Monitoring
- Monitoring points PRB-1 (within PRB) and PRB-2 (downgradient of PRB) were utilized to evaluate the effectiveness of the BOS 100® injection.
- Reinstallation of monitoring well MW-20S in the soil mixing treatment area.
- Confirmation soil samples were collected at 2 feet (0.6 m) vertical intervals at 4 locations within the soil mixing area
- Monitoring well MW-18 has been used to assess the performance of the CAT 100 injection since April 2020
Results
- The BOS 100 PRB performed very well and reduced TCE concentrations (on average) 98.3% (PRB-1 Cluster) to 98.5% (PRB-2 Cluster). Note that the PRB wells were destroyed as part of the soil mixing operations.
- The soil mixing portion of the scope of work was also successful. Soil concentrations of TCE decreased on average 96.9% and groundwater concentrations in MW-20 have decreased by 99.4%.
- The more recent CAT 100 injections in the MW-18 source area have reduced TCE concentrations (48 mg/L) to non-detect in 6 months and daughter product concentrations are declining (Figure 2). Evidence of the CAT 100 chemistry is provided by the generation of volatile fatty acids and dissolved gasses such as ethylene (non-detect at baseline) and acetylene.
FIGURE 1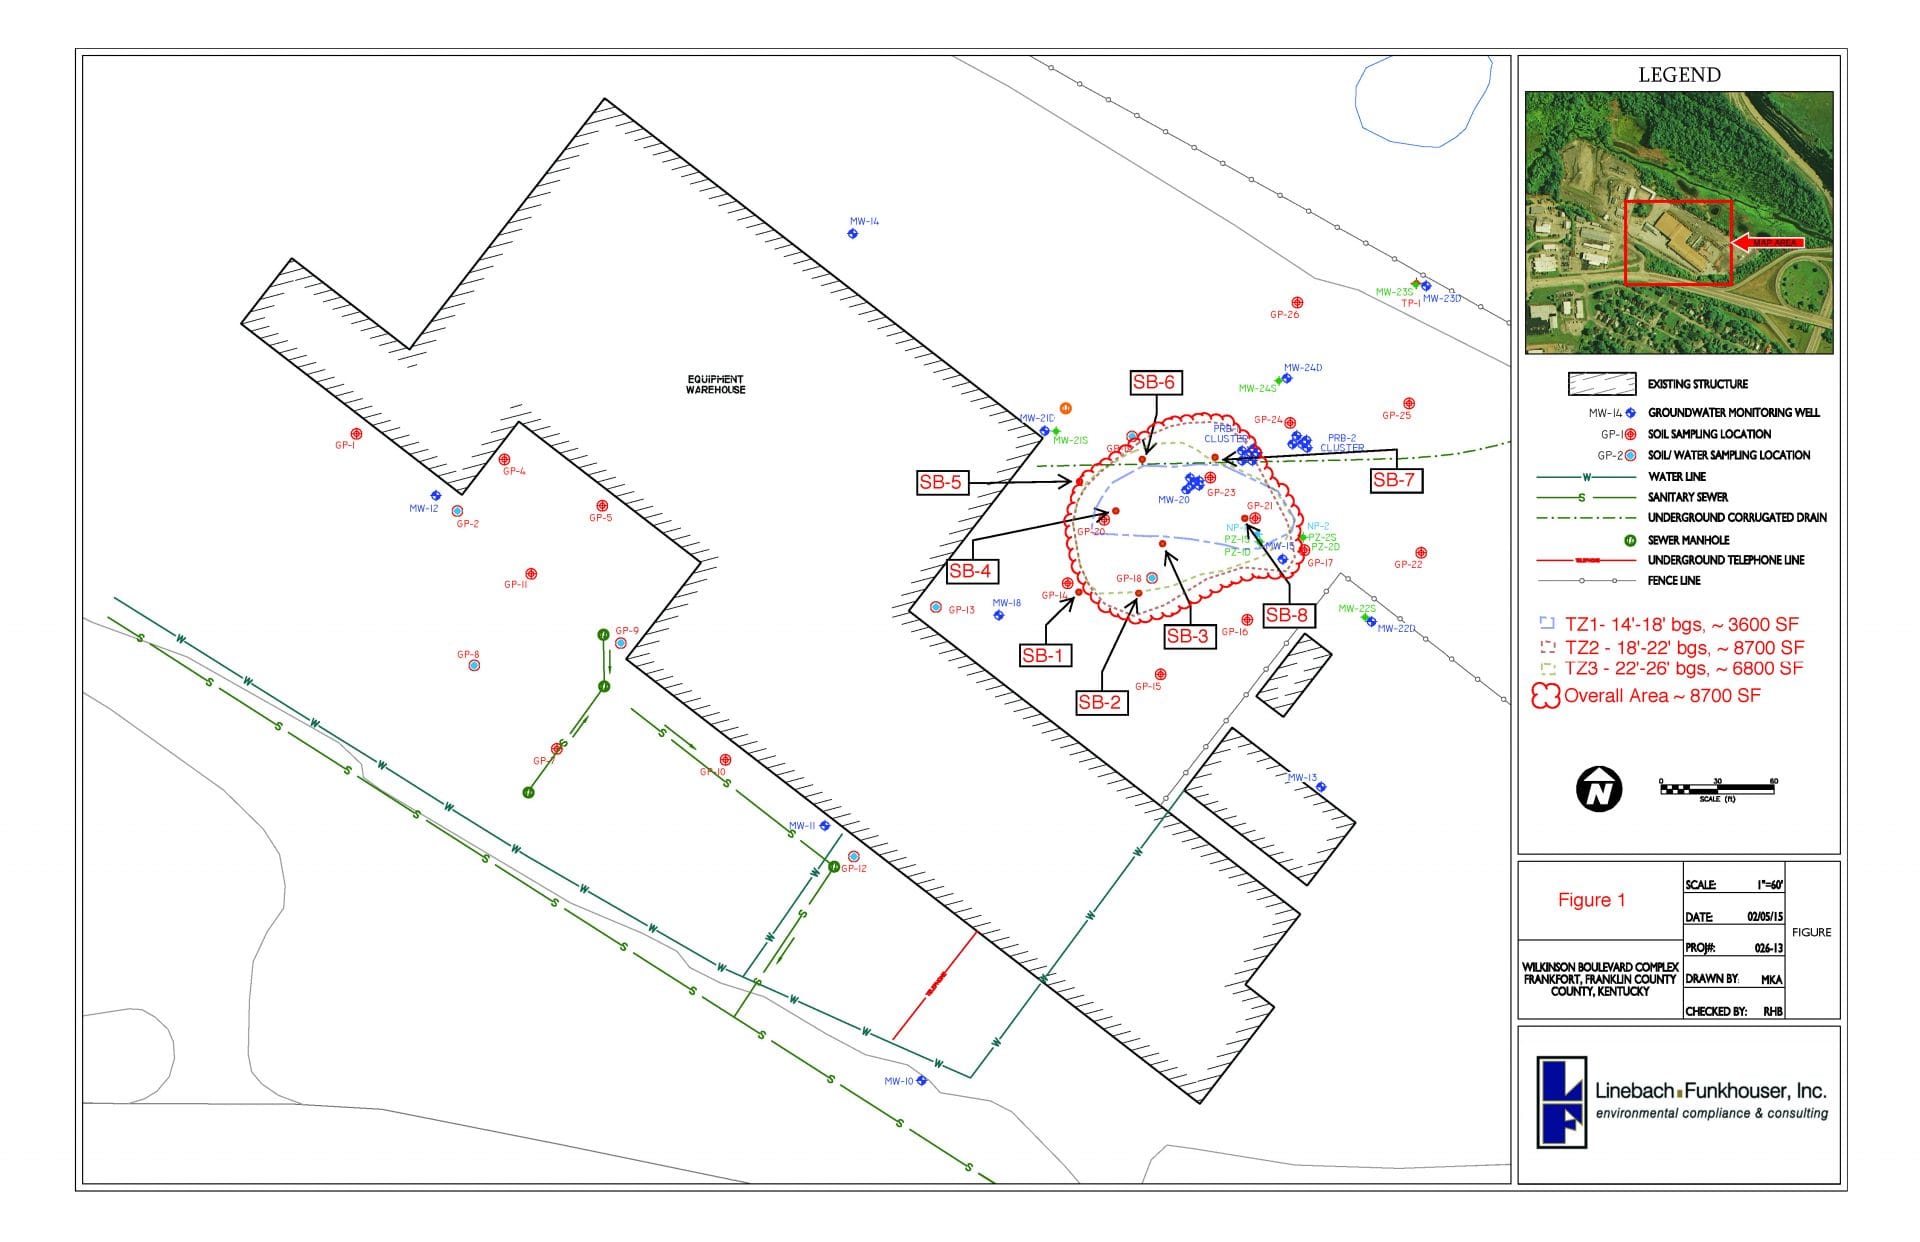 FIGURE 2